note: plot produced using R, plate boundary and earthquake data(01/Jan/2014-20/Dec/2016) with minimum magnitude of 5 or greater
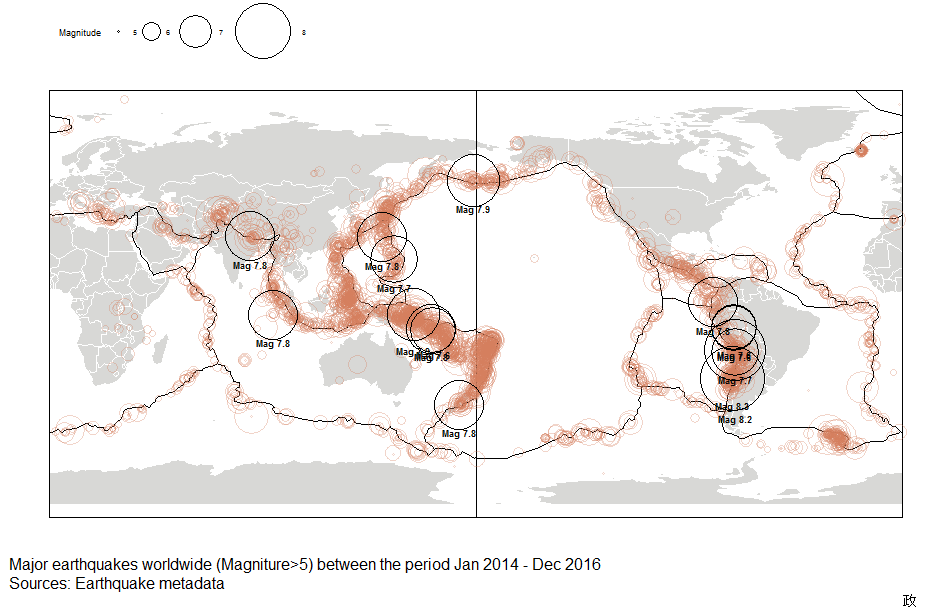 P.S…never really looked into earthquake data until the recent Kaikorua event happened in NZ and it elevated my curiosity in this space. In a nutshell, although it was obvious that NZ and South America are sitting on several fault lines and that they are in the deforming plate boundary zone. but looking at the number of earthquakes illustrated graphically gave me a bit of a shock.
Have anyone previously applied machine learning in catastrophe/risk management, more specifically, in attempting to predict earthquakes (e.g. using a large number of time series data to put into machine learning algorithms to output a predicted classification)? please let me know
Leave a Reply